- August 21, 2022
Ethereum Price Forecast: Is the ETH price bouncing now?

The Ethereum price has fallen very sharply today and is therefore on the verge of reaching significant support. Is the ETH price bouncing violently now?
Ethereum price breaks out bearishly
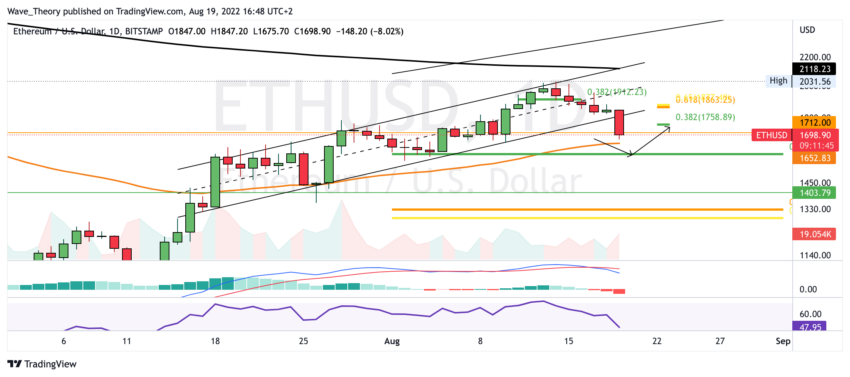
The Ethereum price has broken out of the parallel upward channel bearishly and is therefore on the verge of reaching the important support between 1.590 and 1.653 USD. Ethereum could bounce very strongly there in order to target the next Fib resistance at around $ 1,760.
In addition, the histogram of the MACD in the daily chart is ticking bearishly lower and the MACD lines are crossed bearishly. Meanwhile, the RSI is on the verge of reaching oversold regions. Overall, Ethereum is extremely bearish with today’s downward movement. But there is still hope for a continuation of the upward movement. For this, Ethereum should bounce off the support violently.
If Ethereum does not bounce, it could fall to around $1,300
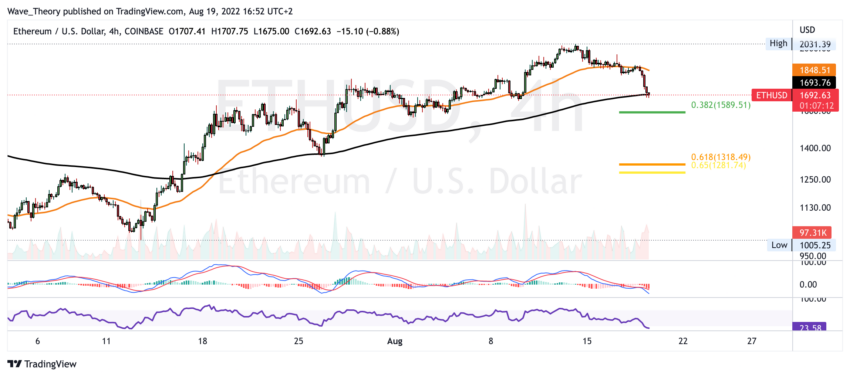
If Ethereum does not bounce to continue the upward movement, it could possibly fall to the Golden Ratio at around $ 1,300. There, Ethereum once again has the chance to bounce violently in order to once again target the price target of the Golden Ratio at around $ 2,600.
Ethereum in danger: Bearish Candle formation on the weekly chart
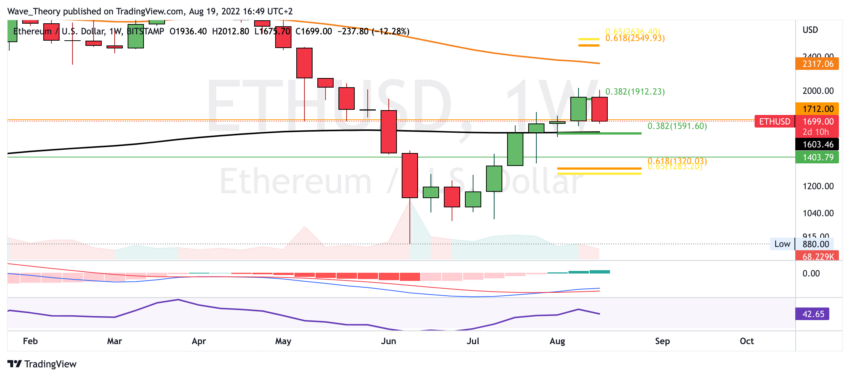
In the weekly chart, however, a bearish candle formation threatens, after which the following weeks could also be very bearish. So a weekly closing price below $1,700 would be very bearish for Ethereum.
However, the histogram of the MACD is still ticking bullish higher in the weekly chart and the MACD lines are still crossed bullish. In addition, at the 0.382 Fib level, the 200-week EMA is around $ 1,600, which also acts as a significant support.
Will the Ethereum price stay above the 50-month EMA?
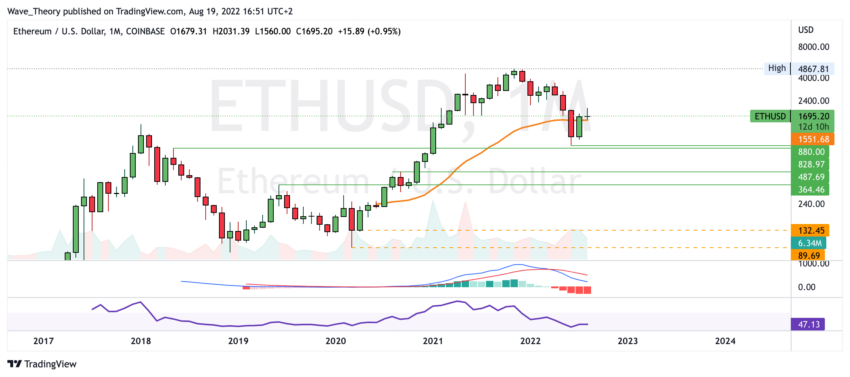
There are still a little less than two weeks left until the monthly candle closes. Ethereum should definitely stay above the 50-month EMA at around $ 1,552 in order not to lose its bullish momentum. Because the histogram of the MACD now seems to be ticking bearishly lower again. This reduces the chances of a bullish trend reversal.
If Ethereum itself breaks the Golden Ratio support at around $ 1,300 bearishly, Ethereum could again return to the last low at around $ 880. Otherwise, Ethereum will only find support between $ 365 and $490 again.
Against BTC, the Ethereum price could now be rejected at the Golden Ratio resistance
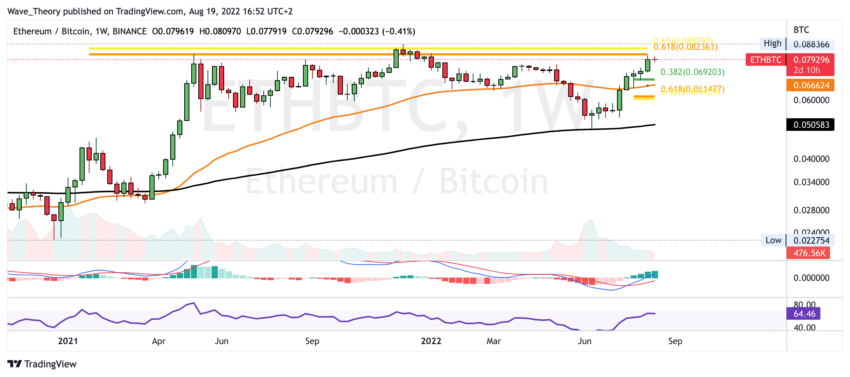
Against BTC, the MACD is still clearly bullish on the weekly chart, because the histogram is ticking bullish higher and the MACD lines are crossed bullish. Nevertheless, Ethereum could now be rejected again at the Golden Ratio resistance at around 0.085 BTC. Ethereum then finds the next significant Fibonacci supports at around 0.069 BTC and at around 0.061 BTC.
Go to the last Ethereum Price Forecast is it possible here.
Disclaimer
All information contained on our website is researched to the best of our knowledge and belief. The journalistic articles are for general information purposes only. Any action taken by the reader on the basis of the information found on our website is done exclusively at his own risk.


