- August 21, 2022
Ethereum Classic Price Forecast: ETC price bounces off Correction target

The Ethereum Classic price fell from around 46 USD to around 32 USD and followed our last price forecast of July 30. Is ETC rising now?
The last Ethereum Classic price forecast was published a day after reaching the peak at around 46 USD and just three days later the ETC price stood at 32.2 USD. As a result, the ETC price rose again to around 46 USD, and then returned to support at around 33 USD. This time, however, the ETC price reached around 31.25 USD and bounced off the 50-day EMA.
Ethereum Classic Price Bounces On 50-Day EMA Support
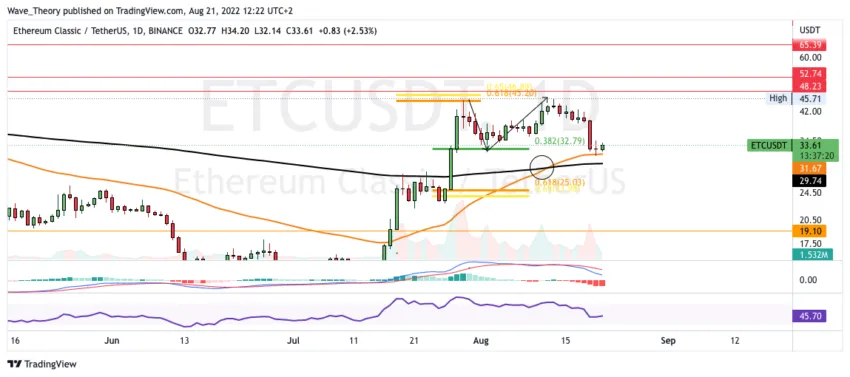
The Ethereum Classic price was rejected a second time at the Golden Ratio resistance at around $ 46 and then returned to the correction target of the 0.382 Fib level at $ 32.8 again. This time, however, the ETC price established a low point at around 31.2 USD and bounced off the 50-day EMA.
Should the ETC price bounce even stronger now, it will find significant Fibonacci resistance at around $ 36.8 and $ 41.5. Only when the golden ratio breaks at around $ 41.5, the correction phase is over. Otherwise, the ETC price could fall even lower.
In addition, the histogram of the MACD ticks bearishly lower in the daily chart and the MACD lines are also crossed bearishly. The RSI is neutral. In contrast to these bearish indicators, the EMAs are still in a bullish golden crossover, which means that the trend remains bullish in the short to medium term.
MACD’s Weekly Histogram starts to weaken
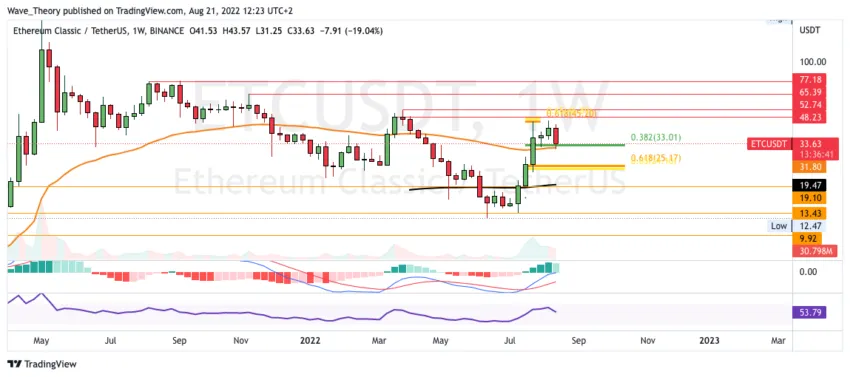
The ETC price is still above the 50-week EMA at around 31.8 USD and thus the correction is still in a healthy framework, with prospects for a continuation of the upward movement and, if necessary, a break in the golden ratio at around 46 USD. Then the ETC price will find the next significant resistance between $ 48 and $ 53.
Nevertheless, the ETC price could also fall even lower if ETC breaks the 50-week EMA bearishly at around $ 31.8. Then ETC will only find significant Fibonacci support again at around 25 USD.
After all, the MACD’s histogram is already starting to tick bearishly lower this week. However, the MACD lines are still crossed bullish and the RSI is also neutral here.
The last month could hardly have been more bullish
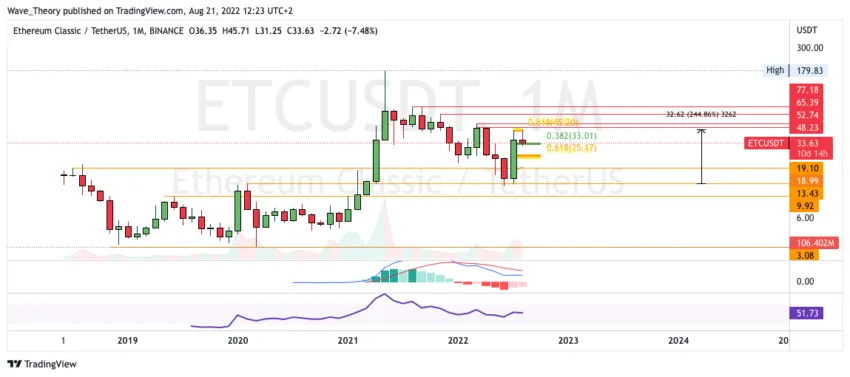
Last month, the Ethereum Classic price rose almost 250%, but only reached the Golden Ratio resistance at around $ 46. The bearish rejection at this Fib level confirms the bearish trend. In order for the ETC price to initiate a bullish trend reversal, the break of the golden ratio at around $ 46 is the least.
ETC should now at least stay above 25 USD. Otherwise, ETC could return to support between $10 and $14. Furthermore, the MACD is rather bullish on the monthly chart, because the histogram has been ticking bullish higher since last month.
Against BTC, it looks like a bearish rejection at the Fib level
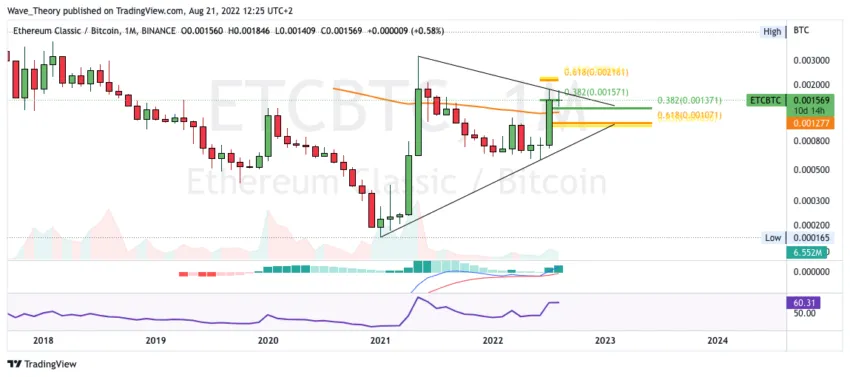
Against BTC, the ETC price is still very bullish when looking at the MACD. Because the histogram is ticking bullish higher and the MACD lines are crossed bullish.
Nevertheless, it currently looks like a bearish rejection at the 0.382 Fib resistance at around 0.00157 BTC. ETC is now finding significant supports between 0.001277 BTC and 0.00137 BTC. Otherwise, significant Fibonacci support is still waiting for the Ethereum Classic course at around 0.00107 BTC. Towards the top, ETC encounters the next significant resistance at around 0.00217 BTC.
The latest Ethereum Classic price forecast can be found here.
Disclaimer
All information contained on our website is researched to the best of our knowledge and belief. The journalistic articles are for general information purposes only. Any action taken by the reader on the basis of the information found on our website is done exclusively at his own risk.


