- August 23, 2022
Bitcoin Price Forecast: Will we see a new low soon?

The Bitcoin price is at a crossroads. There are still bullish opportunities, but there is not much left for BTC to fall to a new low.
Bullish: Bitcoin Price Maintains series of higher Highs and lows
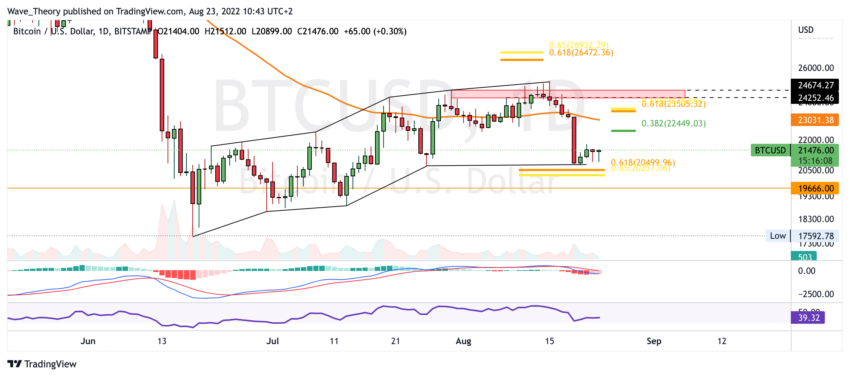
In the daily chart, there is still bullish hope for the Bitcoin price. Finally can Bitcoin despite the violent crash from around $ 25,200 to $ 20,750, a higher low point is forming and thus maintaining the series at higher lows and highs. In addition, the histogram of the MACD begins to tick bullish higher in the daily chart.
However, the MACD lines are crossed bearishly and the RSI gives neither bullish nor bearish signals. In order for the series to be maintained at higher high points, Bitcoin must now break the Fib resistances at around $ 22,450 and $ 23,500. In addition, the 50-day EMA resistance is around $ 23,000 in between.
If Bitcoin does not break these resistances, the correction will remain intact and BTC may continue the downward trend. The decisive Fibonacci support is around $ 20,500. If this support can hold, the bullish chances remain. If it is broken bearishly, Bitcoin may return to the last low at around $ 17,600 or even fall even lower.
Weekly MACD is still bullish
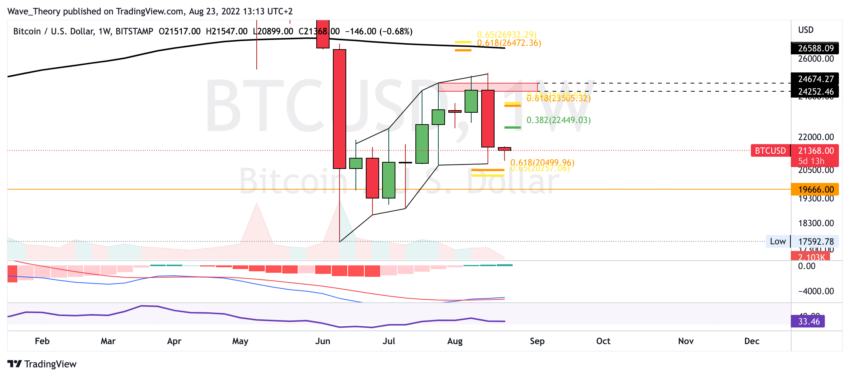
In the weekly chart, the MACD lines are still crossed bullish and the histogram is still ticking bullish higher. Sshould BTC break the next Fib resistances, there is a horizontal resistance waiting between $24,250 and $24,675. Just above that, at around $ 26,800, there is significant resistance at the Golden Ratio, through which the 200-week EMA also runs.
If Bitcoin breaks the 200-week EMA at around $26,800, the next Fibonacci resistances are around $29,000 and $37,000. In particular, $ 37,000 acts as an important resistance, because several Fib resistors converge there.
Bitcoin Price could not overcome 50-month EMA
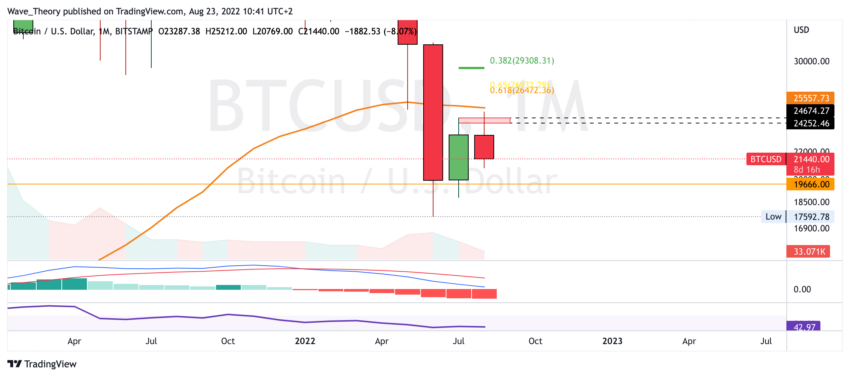
In the monthly chart, the BTC price is extremely bearish. On the one hand, the histogram of the MACD ticks bearishly lower and the MACD lines also remain bearishly crossed. On the other hand, BTC did not even reach the 50-month EMA and remains far from breaking it this month.
Bitcoin price finds significant support between 14,000 and 20,000 USD
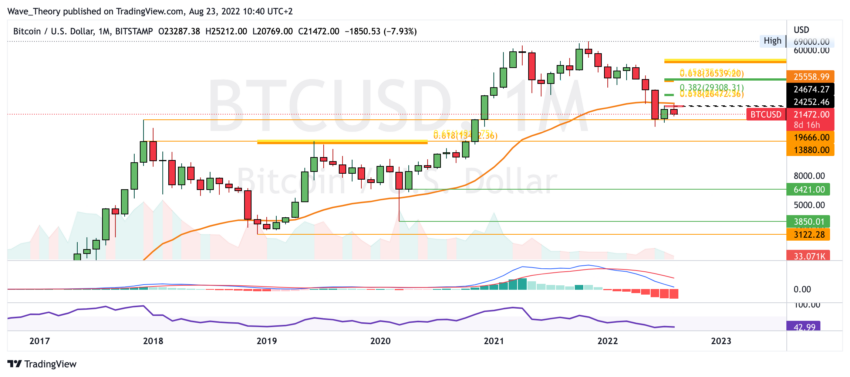
Should the bearish scenario materialize and Bitcoin breaks support at around $20,500 bearish, Bitcoin could correct between $14,000 and $17,600. If this support does not hold, BTC could even correct between around $ 3,850 and $ 6,420. But before that, BTC still finds small support at around $ 10,500.
There is no bullish confirmation in the monthly chart
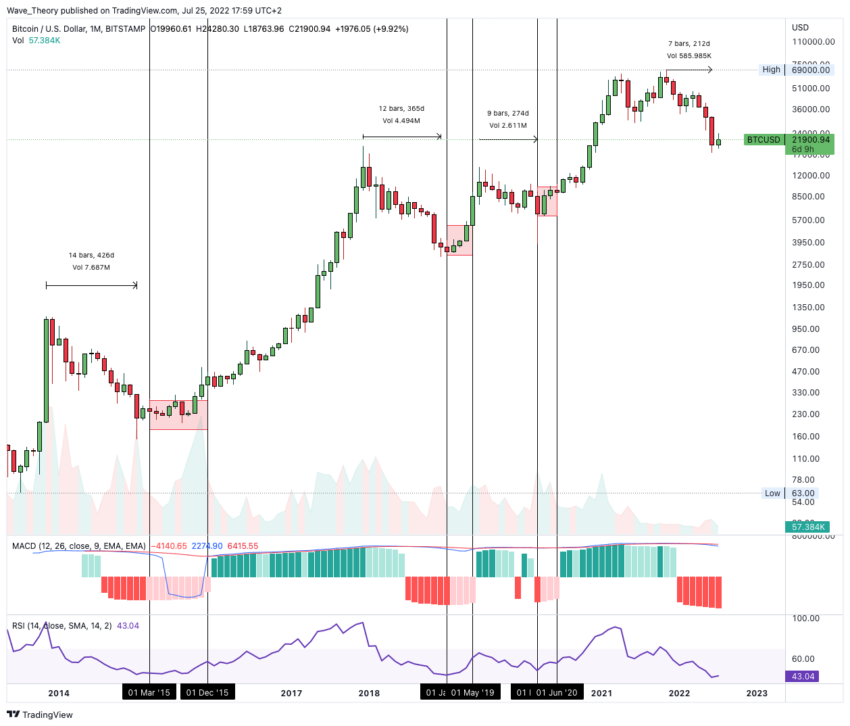
If the last week had not been so extremely bearish, there could have been a bullish trend confirmation in August. Now the bullish confirmation is missing and there is no hope that Bitcoin will receive it this month.
For this, the histogram of the MACD in the monthly chart would have to close bullish higher. At the last three low points of the Bitcoin price, the monthly histogram of the MACD ticked bullish higher after the bottom was reached. Without a higher-ticking histogram, the floor is still out of reach.
Theoretically, it would also be possible for Bitcoin to move sideways for months and $17,600 marked the bottom to get a bullish confirmation. This is very unlikely and if there is no bullish confirmation, the floor may be below $ 17,600.
You can find the latest Bitcoin price forecast here.
Disclaimer
All information contained on our website is researched to the best of our knowledge and belief. The journalistic articles are for general information purposes only. Any action taken by the reader on the basis of the information found on our website is done exclusively at his own risk.


